(Part 3 of the “Why Average?” trilogy from the week of Aug 7-14. Here’s Part 1. Here’s Part 2.)
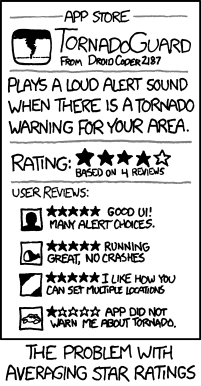
Over the past week, the topic of averaging grades has risen to the forefront of the twitter-verse. Posts abound around the issues that professional educators have with lumping several disparate values together in the hopes of describing a student’s level of competence or understanding. (For reminder of these posts, see Why Average?, xkcd’s TornadoGuard, David Wees’ A Problem with Averages, and Frank Noschese’s Grading and xkcd.)

http://kishmath421.pbworks.com/w/page/7782913/Math-Cartoons
After seeing so many (including myself) highlight the inadequacy of averaged grades, the words of our county’s assistant superintendent come to mind: “If you offer a problem, you’d better be ready to suggest a solution.” That being said, here are a few alternatives to sole reliance on averaging student data to describe their competence, organized by the issues described in Part 2 of this “Why Average?” trilogy.
Issue 1: Averages of data that do not match intended outcomes do not suddenly describe outcome achievement.
The xkcd comic (along with the correlation to education on Frank’s blog) ties in most closely to this issue. So often, we as educators assign points (and therefore value) to things that do not necessarily relate to outcome achievement. Assigning grades for homework completion, timeliness- even extra credit for class supplies- and combining them with outcome achievement data introduces a high level of “grade fog”, where anyone looking at the final grade would have a high degree of difficulty in parsing out the components that led to a student’s grade.
In his article, “Zero Alternatives”, Thomas Guskey lays out the six overall purposes that most educators have for assigning grades:
- To communicate the achievement status of students to parents and others.
- To provide information students can use for self-evaluation.
- To select, identify, or group students for specific educational paths or programs.
- To provide incentives for students to learn.
- To evaluate the effectiveness of instructional programs.
- To provide evidence of a student’s lack of effort or inability to accept responsibility for inappropriate behavior.
Frank Noschese’s blog post highlights these cross-purposes: in the image paired with the xkcd comic, the student’s grade of B seems to come from averaging grades that are meant to provide motivation (“I do my homework”, “I participate in class”), responsibility (“I organize my binder”) and information on achievement (“I still don’t know anything”).
The simple answer to this issue would be to stop averaging grades for things like homework completion, class participation, and responsibility together with values for student achievement. Instead, make grades specifically tied to meeting standards and course objectives. Of course, if it were that easy, we would all be doing it, right? I guess the bigger question is, How do we provide the desired motivation and accountability without tying it to a student’s grade? Guskey’s article suggests several ideas for how one might differentiate these cross-purposes (e.g. a grade of “Incomplete” with explicit requirements for completion, separate reports for behaviors, etc). Other alternatives from my own practice:
- Report non-academic factors separate from a student’s grade. Character education is an important part of a student’s profile, though it does not necessarily need to be tied to the student’s academic success. One way of separating the two would be to report the two separately. I had a category in my gradebook specifically for these kinds of data, though the category itself had no weight relative to the overall grade. Providing specific feedback to students (and their parents) on topics of organization and timeliness separate from achievement grades can go a long way toward getting behaviors to change.
- Set “class goals” for homework and class participation. Sometimes, there is no better motivator than positive “peer pressure”. One of my bulletin boards in my classroom had a huge graph set up, labeled, “Homework completion as a function of time”. Each day, we would take our class’ average homework completion, and put a sticker on the graph that corresponded to that day’s completion rate for the class. We set the class goal as 85% completion every day, and drew that level as the “standard” to be met. As a class, if we consistently met that standard over the nine-week term, there was a class reward. One unintended consequence: each class not only held themselves to the standard, but also “competed” with other class periods for homework supremacy! (Of course, there was that one class that made it their mission to be the worst at completing homework…goes to show that not every carrot works for every mule.)
- Make homework completion an ‘entry ticket’ for mastery-style retests. If homework’s general purpose is to promote understanding, one would assume a correlation between homework completion and achievement. While I ‘checked’ for homework completion on a daily basis and recorded student scores under a “Homework” category, that category had no weight in the student’s overall grade. Instead, once the summative assessment came up, those students who did not reach the sufficient level of mastery needed to show adequate attempts on their previously assigned work before we could set a plan for their re-assessment. You may think that students would “blow off” their homework assignments in this situation- and some did, initially. However, once they engaged in the process, students did what was expected of them. Over time, there was no issue with students being unmotivated to do their homework as necessary.
Issue 2: Averages of long-term data over time do not suddenly describe current state understanding.
This issue is a little trickier to manage. On his blog Point of Inflection, Riley Lark summed up his thinking on the subject of how to best describe current state understanding with a combination of long-term data in a post entitled, Letting Go of the Past. In the post, he compares straight averages to several other alternatives, including using maximums and the “Power Rule” (or decaying average). I strongly suggest all those interested in this topic read Riley’s post. Riley has since created ActivGrade, a standards-based gradebook on the web that “[makes] feedback the start of the conversation- instead of the end.”
For some other resources for ideas:
- On his blog Laid-Back Science, Sam Evans went into great detail how he organized an assessment practice without averages in this post, “My Standards-Based Grading Policy (Seriously, There Are No Numbers)”.
- Sean Cornally (author of the pointedly hilarious ThinkThankThunk blog) has a collection of his ideas regarding standards-based assessment and reporting. He also has a standards-based “gradebook” experiment in beta mode, called Blue Harvest. It should be worth checking out.
- The aforementioned Frank Noschese has several posts of interest on this topic, including, “SBG: Keeping Track of It All”.
- Dan Meyer‘s collection of blog posts on assessment on his blog dy/dan are all must-reads, especially for math teachers (though equally applicable to any content area teacher).
- For self-promotion’s sake, I’ll include one of my posts, entitled, “Standards-Based Grading, or How I Learned to Stop Worrying and Defuse the Bomb”.
– – – – – – – – – –
At the heart of the question “Why Average?” is a push to purpose. While none of the ideas described in this trilogy of posts are inherently right, at the very least, I hope that it has brought readers some “jumping-off points” on how to ensure that their methods match their intended purpose. We owe at least that much to our students. If you have other resources, ideas, or questions that would extend the conversation further, please share them by all means.